Follow us on LinkedIn
Let's face it - getting users to sign up for your product takes real work. Achieving product success and generating enough revenue lies in building a product that’s worth your customer’s time. The more product value, the deeper the engagement.
So, making efforts towards boosting your product adoption rate is the key to achieving customer loyalty and expanding your base of new users.
This post explores the top product adoption rate metrics to help you analyze and improve your user experience. Let's begin!
What is product adoption?
Product adoption is the process by which consumers learn about your product and integrate it into their operations or daily activities to achieve set goals.
When a user tries out a product, they take action towards moving from beginners to enthusiasts. Product adoption is the stage where users have learned enough about your product to use it well for handling their specific problems.
There are different ways brands try to convince visitors to adopt their product.
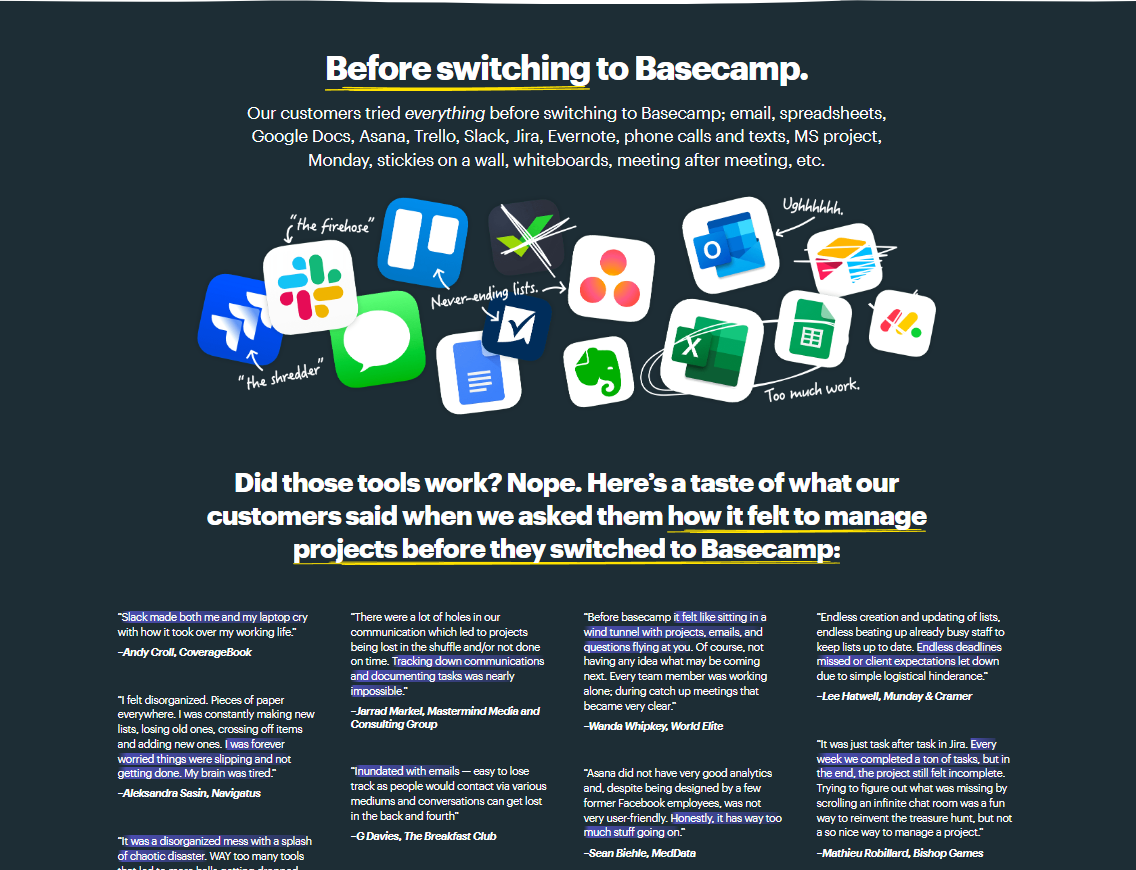
For example, Basecamp uses a ‘before-and-after’ page to make visitors use their project management platform at the evaluation stage. The page highlights what customers suffered before trying Basecamp, followed by testimonials.
Why is it important to track product adoption metrics?
Tracking product adoption metrics provides insights into how users interact with your product. The metrics show the aspects that resonated well with the users and the ones that require improvement.
Product adoption metrics also offer valuable insights that inform decision-making. They guide your product roadmap, help optimize user personas, and enhance user experience and overall product satisfaction.
Moreover, the metrics also help identify the features users struggle with so you can guide users for better feature adoption.
12 essential product adoption metrics to track in 2024
1. Activation rate
Activation rate is a product adoption metric that measures the ratio of users who complete a specific set of actions or reach a predefined engagement level within a product. These actions or milestones are the initial steps that convert them into active users of the product.
A high activation rate indicates smooth and successful user onboarding, whereas a low activation rate suggests the need for improvement to drive adoption.
How to calculate the activation rate?
Once you've established specific benchmarks, take into account the number of individuals who fulfilled those benchmarks and divide it by the total number of users who initiated a trial.
Formula:
2. Product adoption rate
Product adoption rate refers to the percentage of users who integrated your product over time into their daily lives or business workflows.
Monitoring this metric shows if you are attracting the right target audience and if your onboarding process guides users to derive maximum value from your product. Additionally, the product adoption rate also helps evaluate product launch success, marketing campaigns, and user engagement efforts.
A high adoption rate entails fast acceptance and use of your product by users, whereas a low rate indicates challenges in attracting and retaining the right audience. In SaaS, 17% is the median product activation rate, whereas a few top-performing SaaS companies reached an activation rate of 65%.
How to calculate the product adoption rate?
Calculating the product adoption rate involves comparing the number of new active users adopting the product to the total user base within a specified timeframe.
Formula:
3. Product stickiness
Product stickiness measures your product’s capability to engage and retain users over a period. A sticky product indicates that customers return to your product over time, strengthening the brand-customer relationship.
In the SaaS industry, the average product stickiness ranges between 13 to 20%. You can consider this as your benchmark when measuring this product adoption metric.
How to calculate product stickiness?
You can calculate product stickiness by calculating the Daily Active Users (DAU)/Monthly Active Users (MAU) ratio.
Formula:
4. Time to value (TTV)
TTV refers to the timeframe users take to derive maximum value from the product after their initial interaction or onboarding. Simply put, this metric measures the timeline between signup and activation, that is, when users become paying customers.
Tracking TTV helps you identify bugs in the onboarding process. The shorter the TTV, the higher the user satisfaction and overall product adoption.
How to calculate TTV?
Once you have the product activation milestone, measure the time taken by the user to reach the activation stage from their first interaction.
Formula:
5. Engagement score
Engagement score gives insights into whether or not your product worked for the users. It measures the interaction level between your product and the user.
A high engagement score suggests that a user is getting great benefits or their desired outcome from your product, which increases their product usage. On the other hand, a low engagement score hints at disappointed users at risk of churning.
How to calculate engagement score?
Set engagement events based on your product, user journey, personas, and other milestones users achieve on their way to product adoption. These events could be:
- Key product features used
- Frequency of usage
- Subscription renewal or upgrade, and more
Assign values within 1-10 to each engagement event (w), considering their importance, and determine the number of times the event occurred (n).
Formula:
6. Feature adoption rate
This metric measures the percentage of users engaging with specific product features and using them to accomplish their goals. Tracking the feature adoption rate helps you identify the most popular features and friction areas where users need support adopting the feature.
Using this metric, you can track how users like your product’s core features, how they adapt to the new features, and their response to the advanced features.
How to calculate the feature adoption rate?
Calculating feature adoption rate is similar to product adoption, but the formula applies to each product feature.
Formula:
7. Active users
The number of users who use your product or application regularly is called active users. A high number of active users indicate that your customers find value in your product.
Measure this product adoption metric on a daily or monthly basis. However, you need to set a benchmark to compare the number of active users depending on your product.
For example, the frequency of usage for a data analytics tool, invoicing software, and a designing tool will vary. While you must measure the Monthly Active Users (MAUs) for an invoicing tool, tracking Daily Active Users (DAUs) for the other two will help you understand how well your users adapted to the product.
How to calculate active users?
Formula:
You can measure the DAU/MAU for calculating product stickiness as well.
8. Average session duration
Average session duration measures the user’s time and attention span on your product. An extended average session duration isn't always a good thing because this metric is specific to the kind of product you're providing to the users.
For example, if the average session duration for the product research feature in Jungle Scout or Helium 10 is 10 minutes, it could indicate that users may be struggling to find or interpret the data they need efficiently, suggesting an opportunity for the platform to improve its user interface or data presentation.
On the other hand, a 10-minute average session duration for the competitor analysis tool implies that users are spending a significant amount of time engaging with the feature, which is a good sign that it is providing valuable insights and a satisfactory user experience.
How to calculate the average session duration?
Once you set an ideal average session duration for your product, use the following formula for calculation.
Formula:
9. Product usage frequency
Product usage frequency is the number of times a user engages with your product to complete a task within a given timeframe. This product adoption metric measures the number of sessions, interactions, logins, or transactions of the user with the product.
Monitoring the product usage frequency helps you determine the highly engaged users who use your product more than the rest. Make a list of these customers and focus on improving their adoption rate and lifetime value to convert them into your brand advocates.
How to calculate product usage frequency?
Measuring product usage frequency involves determining the number of users who use your product within a specific period.
Formula:
10. Customer satisfaction score (CSAT)
The CSAT score helps you gauge the level of customer satisfaction with your product. It evaluates how your customers feel about your product and assists you in making the user experience better.
You can track this metric using CSAT surveys and implement customer feedback to improve your product experience. Use survey questions with a Likert scale of 1-5 to help you quantify your user feedback.
How do you calculate the CSAT score?
Gather the customer responses from your survey and use this formula to calculate the CSAT score.
Formula:
11. Customer lifetime value (CLTV)
CLTV is a product adoption metric that measures the entire revenue your business earns from a particular customer throughout their relationship with you. This metric considers not just the revenue from initial purchases but also repeat purchases, upgrades, upsells, referrals, and cross-sells over a customer’s lifetime.
The higher the CLTV, the better for your business. Prioritizing the customer base that best suits your offering and financial constraints helps you.
How to calculate CLTV?
The formula to measure CLTV generally depends on your product offering. However, it is the total purchases a customer makes minus your cost to acquire the customer.
Formula:
12. Customer retention rate
The rate of customer retention indicates how successfully you can hold onto customers and lengthen their product lifetime. Increased customer loyalty and increased revenue from referrals are two benefits of having a high customer retention rate.
Tracking this product adoption metric also helps you measure customer satisfaction and make efforts to enhance it further.
How to calculate the customer retention rate?
You can measure the customer retention rate by comparing the number of customers you have at the end of a given timeframe to the number of customers you had at the start of the period.
Formula:
Wrapping up
Data is the only way to know if your customers are delighted with your product. Tracking product adoption metrics helps you measure how well users interact with your product, the product features that work best for them, and the ones that could be better.
All in all, product adoption metrics help you make informed strategic decisions toward improving product adoption. So, if you’re striving to make your product the best fit for your customers, prioritize tracking these top product adoption metrics.